
Page 124 - 2021 제24회 통계연보
P. 124
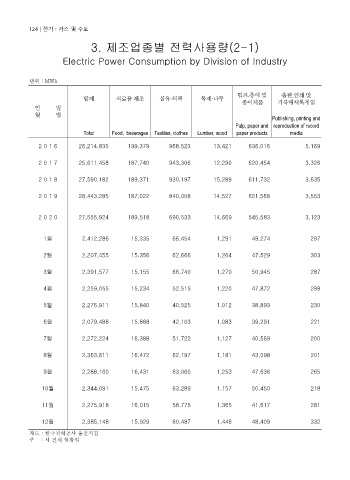
124 | 전기ㆍ가스 및 수도

                                   3. 제조업종별 전력사용량(2-1)

                          Electric Power Consumption by Division of Industry


                단위 : MWh
                                                                                펄프․종이 및      출판,인쇄 및
                                합계        식료품 제조        섬유·의복       목재·나무
                                                                                 종이제품       기록매체복제업
                 연      별
                 월      별
                                                                                          Publishing, printing and
                                                                               Pulp, paper and reproduction of record
                                Total    Food,  beverages  Textiles, clothes  Lumber, wood  paper products  media
                   2 0 1 6     26,214,835     199,379      968,523      13,421     636,016           5,169

                   2 0 1 7     25,611,458     187,740      943,306      12,290     620,454           3,326

                   2 0 1 8     27,590,182     189,371      930,197      15,289     611,732           3,635


                   2 0 1 9     28,443,285     187,022      840,008      14,527     601,568           3,553


                  2 0 2 0      27,555,924     189,518      690,533      14,669     545,583           3,123


                    1월          2,412,286      15,335           66,454    1,291      49,274            297

                    2월          2,207,455      15,356           62,666    1,264      47,529            303

                    3월          2,391,577      15,155           66,740    1,270      50,945            287

                    4월          2,259,055      15,234           52,515    1,220      47,872            288

                    5월          2,276,911      15,840           40,525    1,012      38,893            230


                    6월          2,079,488      15,888           42,103    1,083      39,291            221

                    7월          2,272,224      16,388           51,722    1,127      40,569            200

                    8월          2,363,611      16,472           62,197    1,181      43,098            201

                    9월          2,288,160      16,431           63,060    1,253      47,636            265

                    10월         2,344,091      15,475           63,289    1,157      50,450            218


                    11월         2,275,918      16,015           58,775    1,365      41,617            281

                    12월         2,385,148      15,929           60,487    1,446      48,409            332
                자료 : 한국전력공사 울산지점
                주    : 시 전체 현황임