
Page 126 - 2021 제24회 통계연보
P. 126
126 | 전기ㆍ가스 및 수도
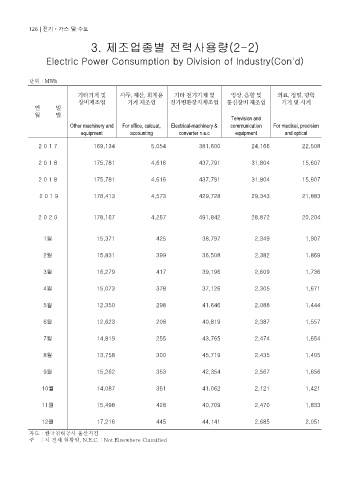
3. 제조업종별 전력사용량(2-2)
Electric Power Consumption by Division of Industry(Con'd)
단위 : MWh
기타기계 및 사무, 계산, 회계용 기타 전기기계 및 영상, 음향 및 의료, 정밀, 광학
장비제조업 기계 제조업 전기변환장치제조업 통신장비 제조업 기기 및 시계
연 별
월 별
Television and
Other machinery and For office, calcuat, Electrical-machinery & communication For medical, precision
equipment accounting converter n.e.c equipment and optical
2 0 1 7 169,134 5,054 381,600 24,166 22,508
2 0 1 8 175,781 4,616 437,791 31,804 15,607
2 0 1 8 175,781 4,616 437,791 31,804 15,607
2 0 1 9 178,413 4,573 429,728 29,343 21,883
2 0 2 0 178,167 4,267 491,842 28,872 20,204
1월 15,371 425 38,797 2,349 1,907
2월 15,831 399 36,508 2,382 1,869
3월 16,279 417 39,196 2,609 1,736
4월 15,073 378 37,126 2,305 1,671
5월 12,350 298 41,646 2,088 1,444
6월 12,623 208 40,819 2,387 1,557
7월 14,819 255 43,765 2,474 1,654
8월 13,758 300 45,719 2,435 1,405
9월 15,262 353 42,354 2,567 1,656
10월 14,087 361 41,062 2,121 1,421
11월 15,498 428 40,709 2,470 1,833
12월 17,216 445 44,141 2,685 2,051
자료 : 한국전력공사 울산지점
주 : 시 전체 현황임, N.E.C. : Not Elsewhere Classified